TBMQ 2.4: Sparkplug support, client lifecycle events, and dropped message analytics

On this page
We’re excited to announce the release of TBMQ 2.4.0 (Community Edition / Professional Edition). This version broadens the protocols and event streams TBMQ speaks to the rest of your stack, rebuilds the metrics surface you monitor it with, and — in the Professional Edition — turns the drop counters into an investigation tool.
Here’s what’s new in 2.4 across both editions:
| New in TBMQ 2.4 | Community | Professional |
|---|---|---|
| Sparkplug 3.0 aware MQTT server | ✓ | ✓ |
| Client lifecycle events for integrations | ✓ | ✓ |
| Rebuilt Prometheus metrics surface | ✓ | ✓ |
| Java 25 and Angular 21 | ✓ | ✓ |
| Dropped message analytics | — | ✓ |
Let’s take a closer look at each change, starting with Community Edition.
Community Edition
Sparkplug 3.0 aware MQTT server
Sparkplug B is the de facto payload and topic specification for MQTT in industrial automation — the layer that turns a generic broker into something a SCADA system, a historian, or an MES can plug into without a bespoke integration for every edge node.
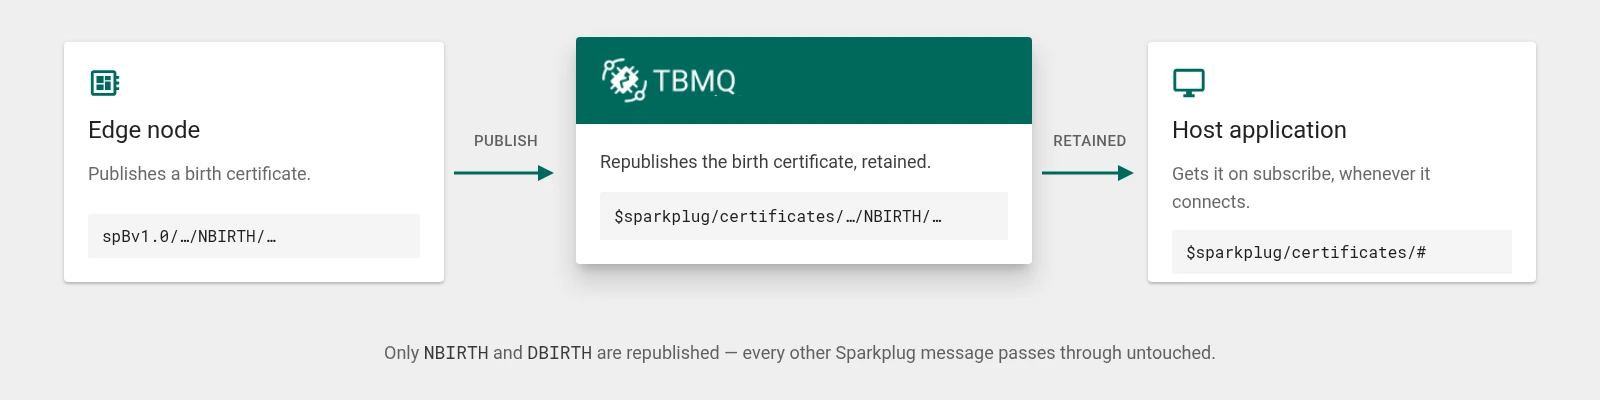
TBMQ 2.4 implements the Sparkplug Aware MQTT Server behavior defined in the Sparkplug 3.0 specification. When an edge node publishes a birth certificate, the broker now keeps a retained copy of it on a well-known topic:
- An
NBIRTHpublished onspBv1.0/{group_id}/NBIRTH/{edge_node_id}is republished on$sparkplug/certificates/spBv1.0/{group_id}/NBIRTH/{edge_node_id}. - A
DBIRTHpublished onspBv1.0/{group_id}/DBIRTH/{edge_node_id}/{device_id}is republished on the matching$sparkplug/certificates/...topic. - The republished copy carries retain = true, so it is stored in the retained message store and delivered to any host application that subscribes later.
- Only
NBIRTHandDBIRTHare republished.NDATA,NCMD,NDEATH,DDATA,DCMD,DDEATH, andSTATEare left alone, exactly as §10.1.4 of the specification requires.
Why it matters
Without server-side birth certificates, a primary host application that connects — or reconnects — after an edge node has already sent its NBIRTH has no way to learn that node’s metric aliases, data types, and metadata. It has to wait for a rebirth, or force one with an NCMD. With a Sparkplug aware broker, the birth certificate is already sitting on $sparkplug/certificates/#, retained, and the host can rebuild its whole view of the namespace from a single subscription at startup.
The behavior is built into the publish path and needs no configuration. Republishing is deliberately best-effort: it never blocks or fails the original publish, and non-Sparkplug topics are rejected by a cheap prefix check before any parsing work happens, so the 99% of traffic that isn’t Sparkplug pays essentially nothing for the feature.
Client lifecycle events for integrations
TBMQ 2.1 introduced embedded integrations — HTTP, Kafka, and MQTT targets that forward matching messages out of the broker without a separate bridge process. Until now, an integration could forward messages and nothing else: everything about the clients producing those messages stayed inside TBMQ.
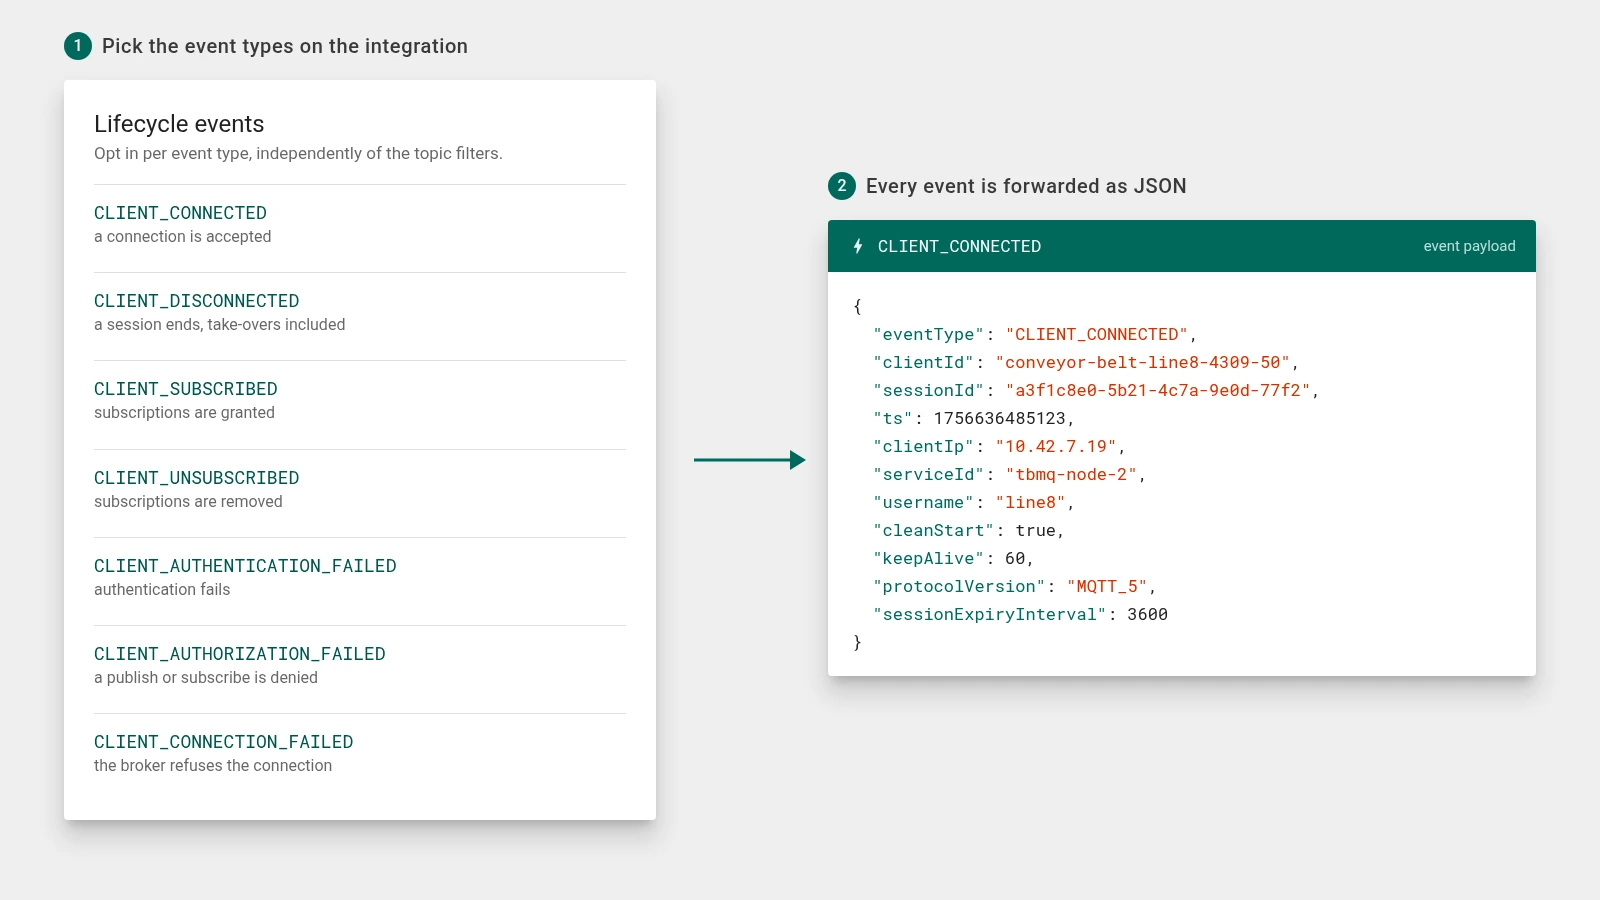
TBMQ 2.4 lets an integration subscribe to client lifecycle events as well, delivered to the same external system as the messages:
| Event type | Emitted when |
|---|---|
CLIENT_CONNECTED |
A client connection is accepted. |
CLIENT_DISCONNECTED |
A client session ends, including a take-over by a session on another node. |
CLIENT_SUBSCRIBED |
Subscriptions are granted. |
CLIENT_UNSUBSCRIBED |
Subscriptions are actually removed. |
CLIENT_AUTHENTICATION_FAILED |
Authentication fails. |
CLIENT_AUTHORIZATION_FAILED |
A publish or subscribe is denied by an authorization rule. |
CLIENT_CONNECTION_FAILED |
The broker refuses the connection for another reason — an exceeded quota, an unavailable server. |
Each event arrives as a JSON object carrying the client ID, session ID, IP address, timestamp, producing node, username, and certificate CN, plus fields specific to the event type — cleanStart, keepAlive, protocolVersion and sessionExpiryInterval for a connect; the granted subscriptions with their QoS and options for a subscribe; the disconnectReason for a disconnect; the denied action and topic for an authorization failure.
Delivery is opt-in per event type and independent of the integration’s topic filters, so an integration can carry messages only, events only, or both. When it carries both, events travel on their own Kafka stream with their own consumer — a slow event target never stalls message delivery, and vice versa.
Why it matters
Connection churn, authentication failures, and subscription changes are the raw material of fleet monitoring, security alerting, and device-state tracking, and until now getting them out of TBMQ meant scraping logs. An integration configured for events streams them straight into the SIEM, the data lake, or the Kafka topic your platform already consumes — no polling, no log parsing, no extra deployment.
Events are best-effort hints by design, deliberately weaker than message delivery: they are produced on the MQTT processing thread, and if Kafka cannot accept the record the event is dropped and counted in droppedLifecycleEvents rather than retried. Treat them as observability, not as an audit trail of record.
See the client lifecycle events documentation for the full payload schema and configuration.
A rebuilt metrics surface
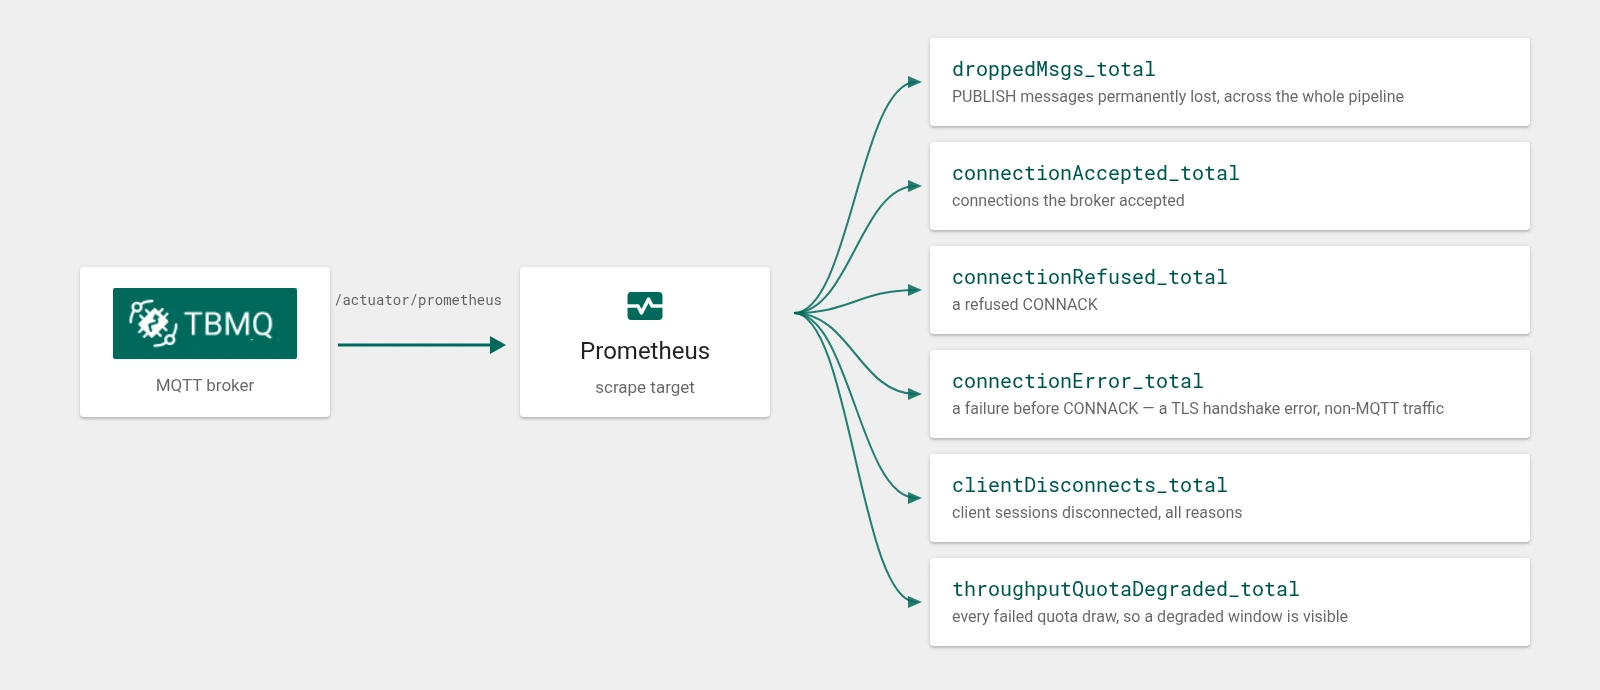
2.4 broadens TBMQ’s Prometheus output and standardizes its shape — wider coverage of the publish and connection paths, and metric names and tags that select and aggregate the way Prometheus expects.
New and reworked series:
droppedMsgs_total— PUBLISH messages permanently lost, now covering the whole PUBLISH pipeline rather than a handful of call sites.- Connection outcome counters —
connectionAccepted_total,connectionRefused_total, andconnectionError_totalseparate a refused CONNACK from a failure that never got that far, such as a TLS handshake error or non-MQTT traffic on the port. clientDisconnects_total— client sessions disconnected, all reasons.- Unified actor processing metrics for client and device actors, measured in nanoseconds.
- Counter accuracy fixes across subscription, retained message, and flow control metrics, plus NaN guards and a proper SQL queue depth gauge.
Breaking change: metric and tag renames
Several metrics were renamed so that they can be selected and aggregated the way Prometheus expects. Update your queries, recording rules, alerts, and dashboards before upgrading:
sqlQueue_<QueueName>_total{...}→sqlQueue_total{queueName="<QueueName>", ...}— the queue name moved out of the metric name into a bounded tag. The depth gauge changes the same way, tosqlQueue_queueSize{queueName="<QueueName>", ...}.producer_seconds*{producerId}→kafkaProducer_send_seconds*{producerId}.consumer_seconds*{consumerId, operation="syncCommit"}→kafkaConsumer_commit_seconds*{consumerId}. Theoperationtag was alwayssyncCommitand has been dropped — remove it from label matchers.clientSubscriptionsConsumerkeeps its name, but itsstatsNamevalues change:totalSubscriptions→totalRecords,acceptedSubscriptions→acceptedRecords,ignoredSubscriptions→ignoredRecords.clientSubscriptions→subscriptions, and its meaning changes with it: it now reports the total number of subscriptions across all clients, where it previously reported the number of clients holding at least one subscription. The value is cluster-wide — read it from a single node or usemax, don’t sum across nodes.
The dead msgDownlink counter and the processedBytes historical key were removed. Neither ever produced data, so neither needs a dashboard change.
The full metric catalog lives in the Prometheus metrics reference.
Other improvements
The release also includes a number of narrower updates:
- Java 25 and Angular 21. The broker moves to Java 25 and the UI to Angular 21, keeping both on supported, actively patched runtimes.
- Real client IPs behind a proxy. WS and WSS listeners now honor
X-Forwarded-ForandX-Real-IP, so sessions, lifecycle events, and logs show the client’s address rather than the load balancer’s. - Flow control refactoring. In-flight tracking is now map-based with an event-driven drain, fixing a leak and reducing overhead on the QoS 1/2 path.
- Charts and time windows. The monitoring charts were upgraded with a reworked time-window selector, per-chart zoom, full-screen mode, and Min/Max/Avg/Total/Latest in the legend.
- Protocol correctness fixes. Per-filter
UNSUBACKreason codes, correctedSUBACKreason codes for persist failures and invalid topic filters, client-initiatedDISCONNECTkept in FIFO order with pending PUBLISH, an enforced APPLICATION QoS 1 retry cap withDUPset on retransmit, and a fix for device shared subscription delivery to cross-node subscribers. - Redis and proxy protocol fixes. TLS and username settings now apply to Sentinel client configuration, Redis SSL material is memoized,
PROXYprotocolLOCALconnections used by health checks are no longer closed, andHAProxyMessageis released properly. - Security. Critical and high CVEs in the TBMQ images have been remediated.
Professional Edition
TBMQ PE 2.4 inherits every change above and adds a major PE-exclusive capability of its own.
Dropped message analytics
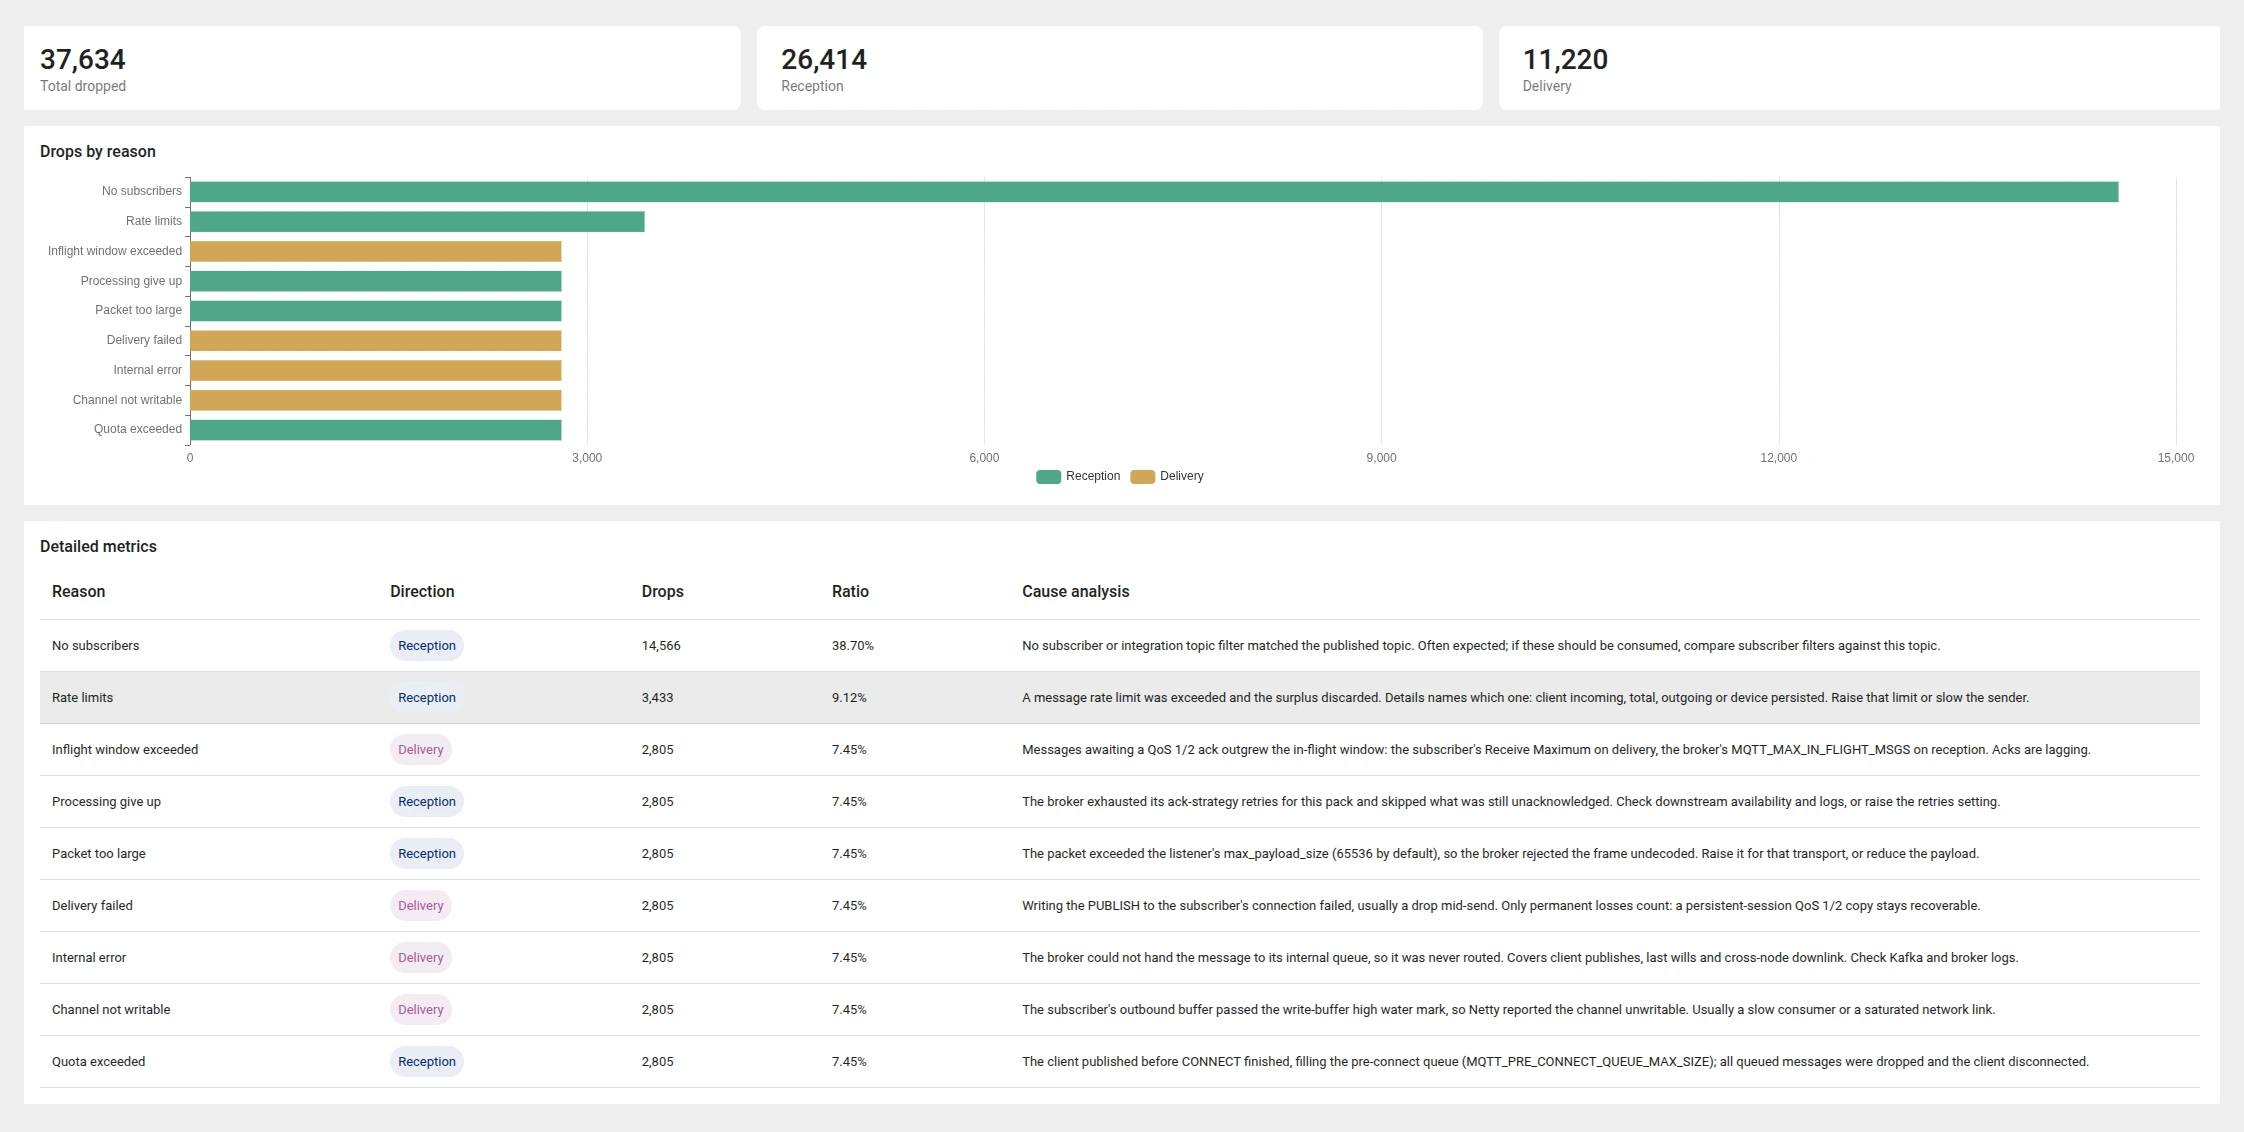
droppedMsgs_total tells you that messages were lost and at what rate. It cannot tell you which client, which topic, or why — and those are the only three things that matter when you are trying to stop the loss.
TBMQ PE 2.4 adds a Dropped messages page that persists every permanent drop together with its cause. Recording is on by default and can be turned off with MQTT_DROPPED_MSG_ENABLED=false.
What gets recorded. Only a permanent loss — a message the broker will not retry. A QoS 1 or 2 message addressed to a persistent session is not counted when delivery fails, because it stays recoverable from Kafka (APPLICATION clients) or Redis (DEVICE clients); if the broker eventually gives up on those retries, the give-up is recorded once. QoS 0 is counted even for a persistent session, since it is never stored.
Drops are aggregated rather than logged one by one: everything sharing the same client ID, reason, topic, and direction collapses into a single row with a running count and first/last timestamps. Each row also carries a direction — Reception (lost on the way into the broker, keyed by the publisher) or Delivery (lost on the way out, keyed by the intended subscriber).
Reasons. Every drop is classified, and each reason comes with a cause and something to check:
| Reason | Direction | Typical cause |
|---|---|---|
| No subscribers | Reception | No subscriber topic filter matched the published topic. |
| Rate limits | Reception, Delivery | A message rate limit was exceeded; the details field names the limit that fired. |
| Packet too large | Reception | The packet exceeded the listener’s max_payload_size. |
| Quota exceeded | Reception | The client published before its CONNECT completed and filled the pre-connect queue. |
| Inflight window exceeded | Reception, Delivery | Unacknowledged QoS 1/2 messages outgrew the in-flight window. |
| Channel not writable | Delivery | The subscriber’s outbound buffer passed the write-buffer high water mark. |
| Delivery failed | Delivery | The write to the subscriber’s connection failed, usually a connection dropped mid-send. |
Analytics. Alongside the table, an Analytics view summarizes the same data: totals split by direction, a drops-by-reason chart, a per-reason metrics table with each group’s share of the total and a short cause analysis, and two rollups — Top topics and Top clients.
Those two rollups are what separate failure shapes the flat table cannot. A table row is a single client-and-topic pairing, so one dead topic published to by a thousand clients fills the list with a thousand near-identical rows. The same situation is one Top topics row with a client count of a thousand — a subscriber-side problem, a subscription never created or created on the wrong filter. The mirror image, one Top clients row with a high topic count, is a publisher-side problem: one client publishing where nothing subscribes.
The filter travels between the two views, topic and client ID each support Contains and Exact match modes, and clicking any value in a details dialog or a rollup row drills straight through to the matching set.
Entries are not kept forever. A cleanup job runs hourly and applies both an age limit (MQTT_DROPPED_MSG_RETENTION_DAYS, 7 by default, measured from the last occurrence so a recurring drop stays visible) and a row cap as a safety net.
The dropped messages guide covers the table, the analytics view, every reason, and the retention settings in full.
Upgrading
The Community Edition upgrade only records the new schema version — no table is created or altered, and no data is migrated. The PE upgrade additionally creates the dropped_msg table and its index.
The one thing to plan for is the metric renames: if you scrape TBMQ, review them before upgrading and update your queries, recording rules, alerts, and dashboards. Step-by-step instructions are in the upgrade guide.
Final words
TBMQ 2.4 pushes the broker outward and inward at once. Outward: Sparkplug 3.0 awareness makes TBMQ a first-class citizen in industrial deployments, and client lifecycle events give the rest of your platform a live feed of what the fleet is doing. Inward: the metrics surface is one you can actually build dashboards on, and — in Professional Edition — every dropped message now carries the client, topic, and reason behind it.
For the complete list of changes, see the Community Edition release notes and the Professional Edition release notes.
If you find TBMQ useful, support the project by starring the TBMQ GitHub repository and by opening issues or pull requests.
Evaluate TBMQ Professional Edition
Dropped message analytics, audit logs, SSO role mapping, white labeling, RBAC, and more — available as a 30-day trial or an upgrade from TBMQ CE.