
Monitoring
TBMQ provides user-friendly tools to monitor broker activity through the Home and Monitoring pages.
Charts
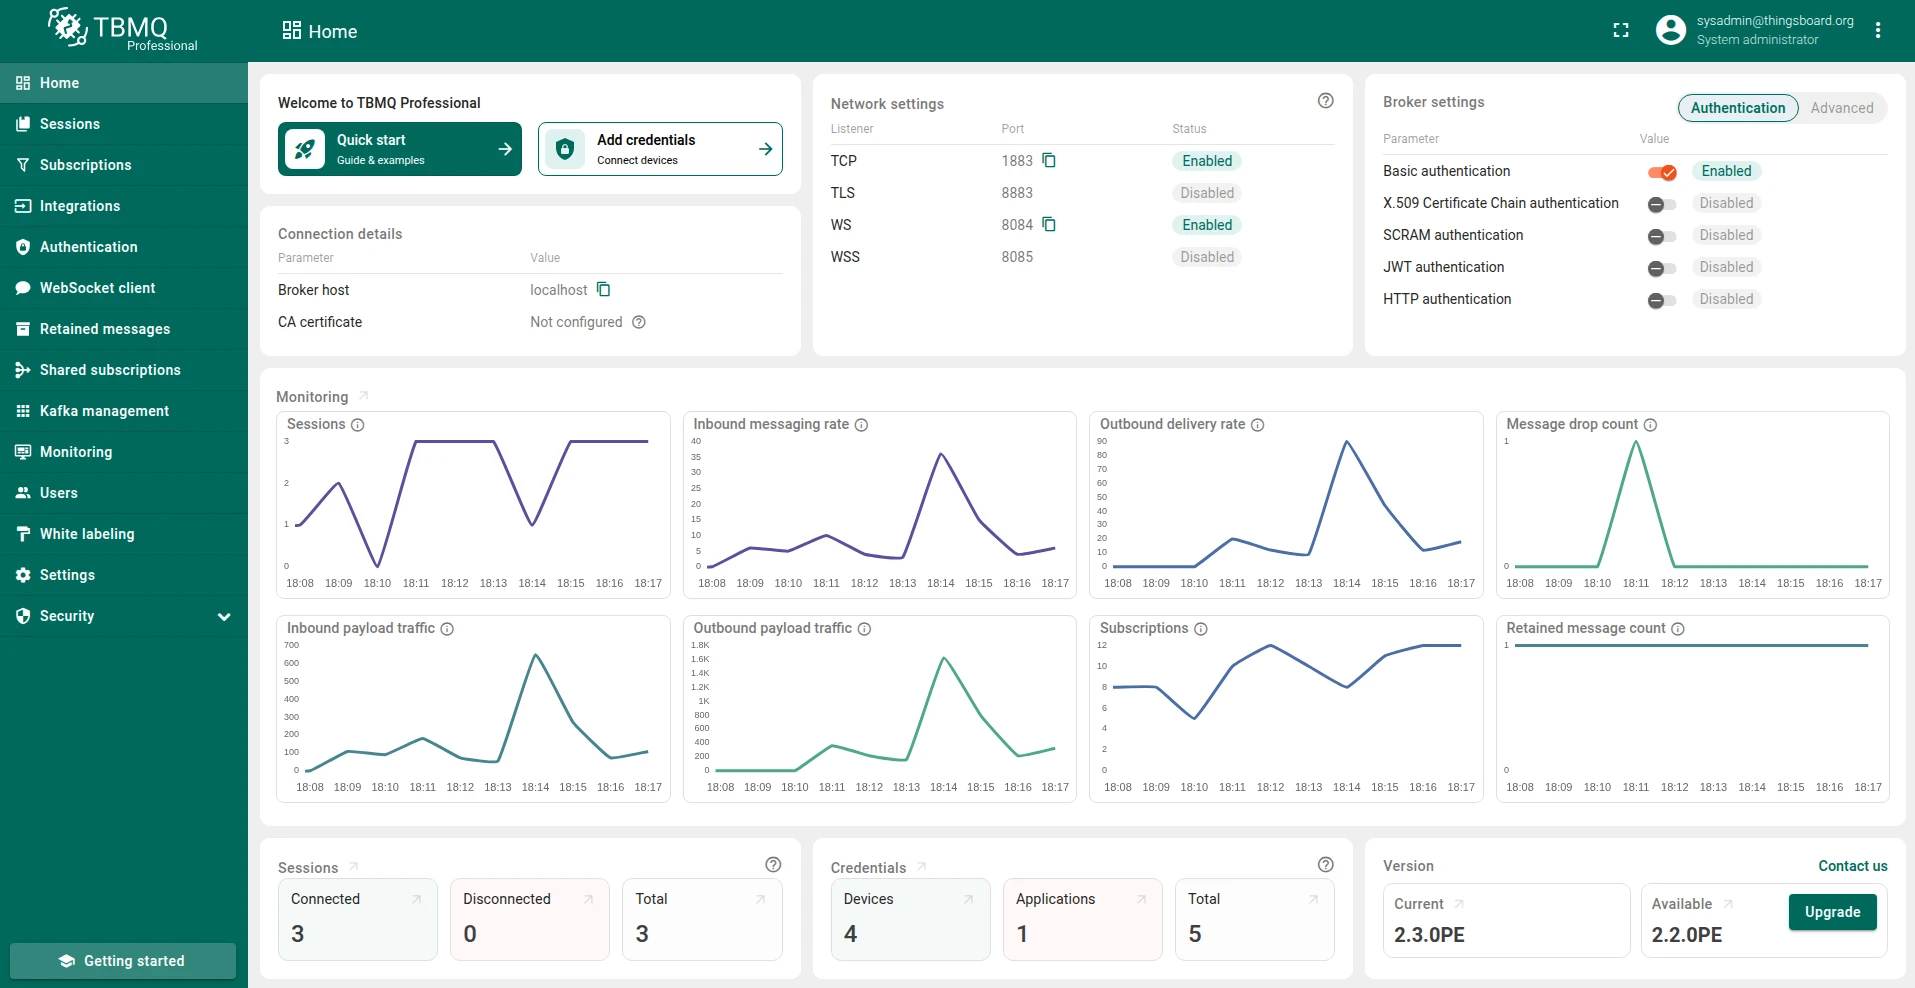
Section titled “Charts”The Home page displays eight compact charts covering the last ten statistics collection intervals — the last 10 minutes with the default interval of one minute. These charts have no controls of their own; click the Monitoring title above them to open the full view.
Monitoring has three sub-pages: State & health and Traffic & performance split the same eight charts for deeper analysis, and Resource usage reports per-service system metrics. Both chart pages open on a real-time window of the last hour — wider if you raise the statistics collection interval above 6 minutes. You can change it for the whole page from the time-window selector in the toolbar, or for a single chart from that chart’s own selector. Here every chart also has a zoom slider (double-click the chart to reset the zoom), a full-screen button (press Esc to leave full screen), and a legend showing Min, Max, Avg, Total and Latest for each series. The two payload traffic charts add a B / KB / MB / GB unit toggle.
State & health
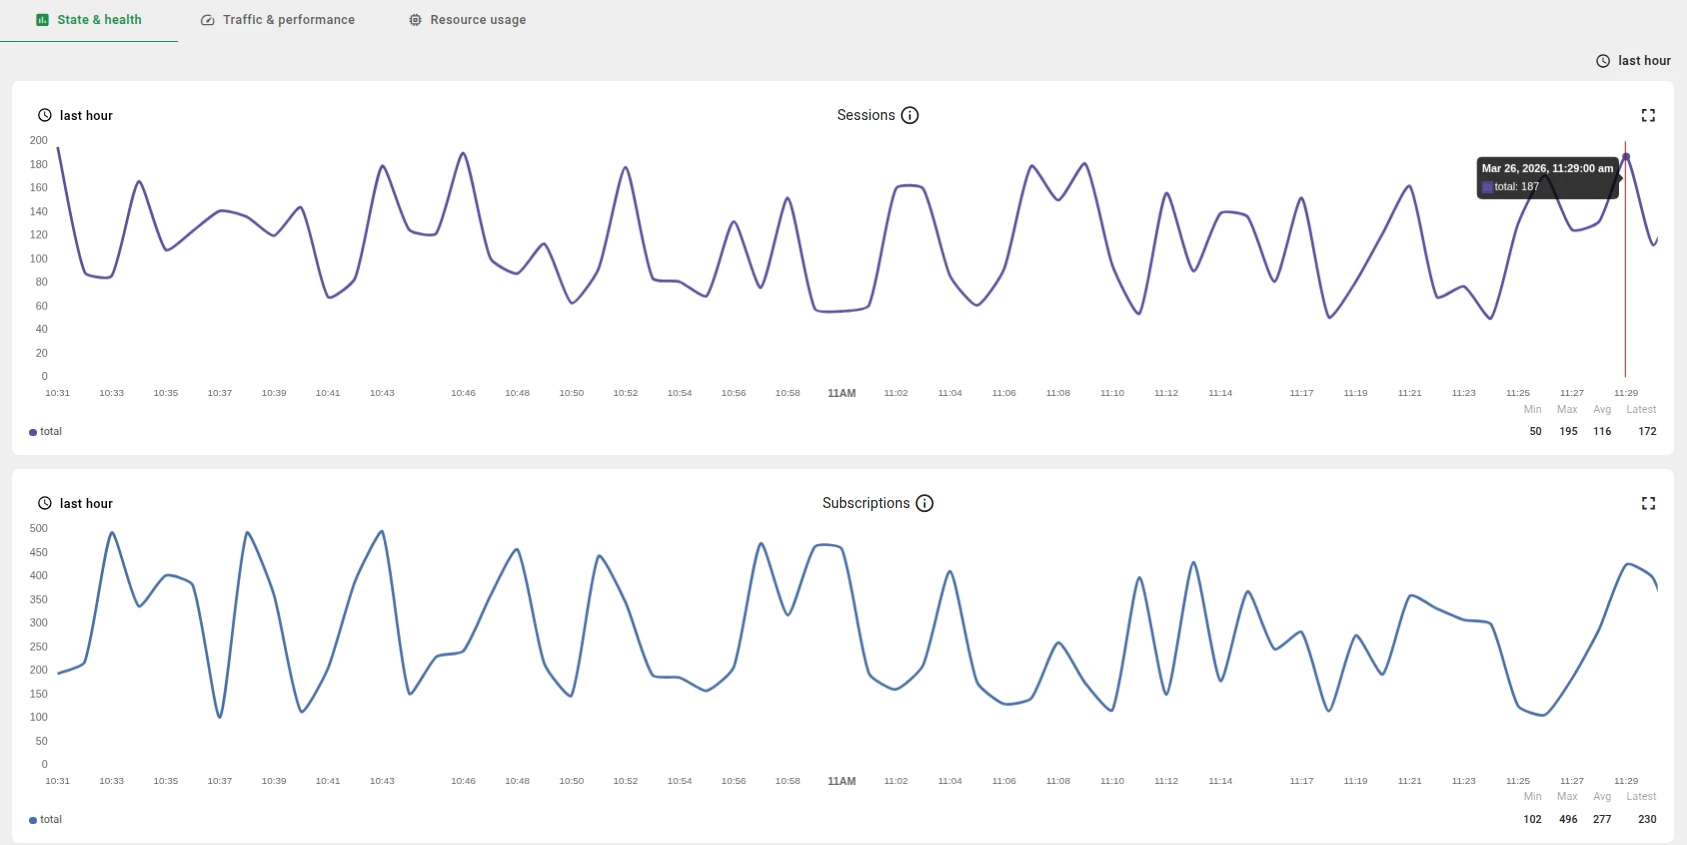
Section titled “State & health”The Monitoring > State & health page contains four charts focused on broker state:
- Sessions — tracks the total count of active client connections and disconnected persistent session records managed by the broker.
- Subscriptions — tracks the aggregate count of all topic filter entries maintained by the broker for both connected and disconnected persistent clients.
- Retained message count — tracks the total count of retained messages currently stored by the broker. This metric represents the number of unique topics holding a “last known state” value, which consumes persistent storage and is delivered immediately to new matching subscribers.
- Message drop count — counts the total number of messages the broker fails to process or deliver. Reasons include lack of subscriber interest (no matching subscriptions), resource limitations (full queues, storage limits), or rate limiting enforcement.
To see which clients and topics those drops belong to, and why each message was lost, open the Dropped messages page.
Traffic & performance
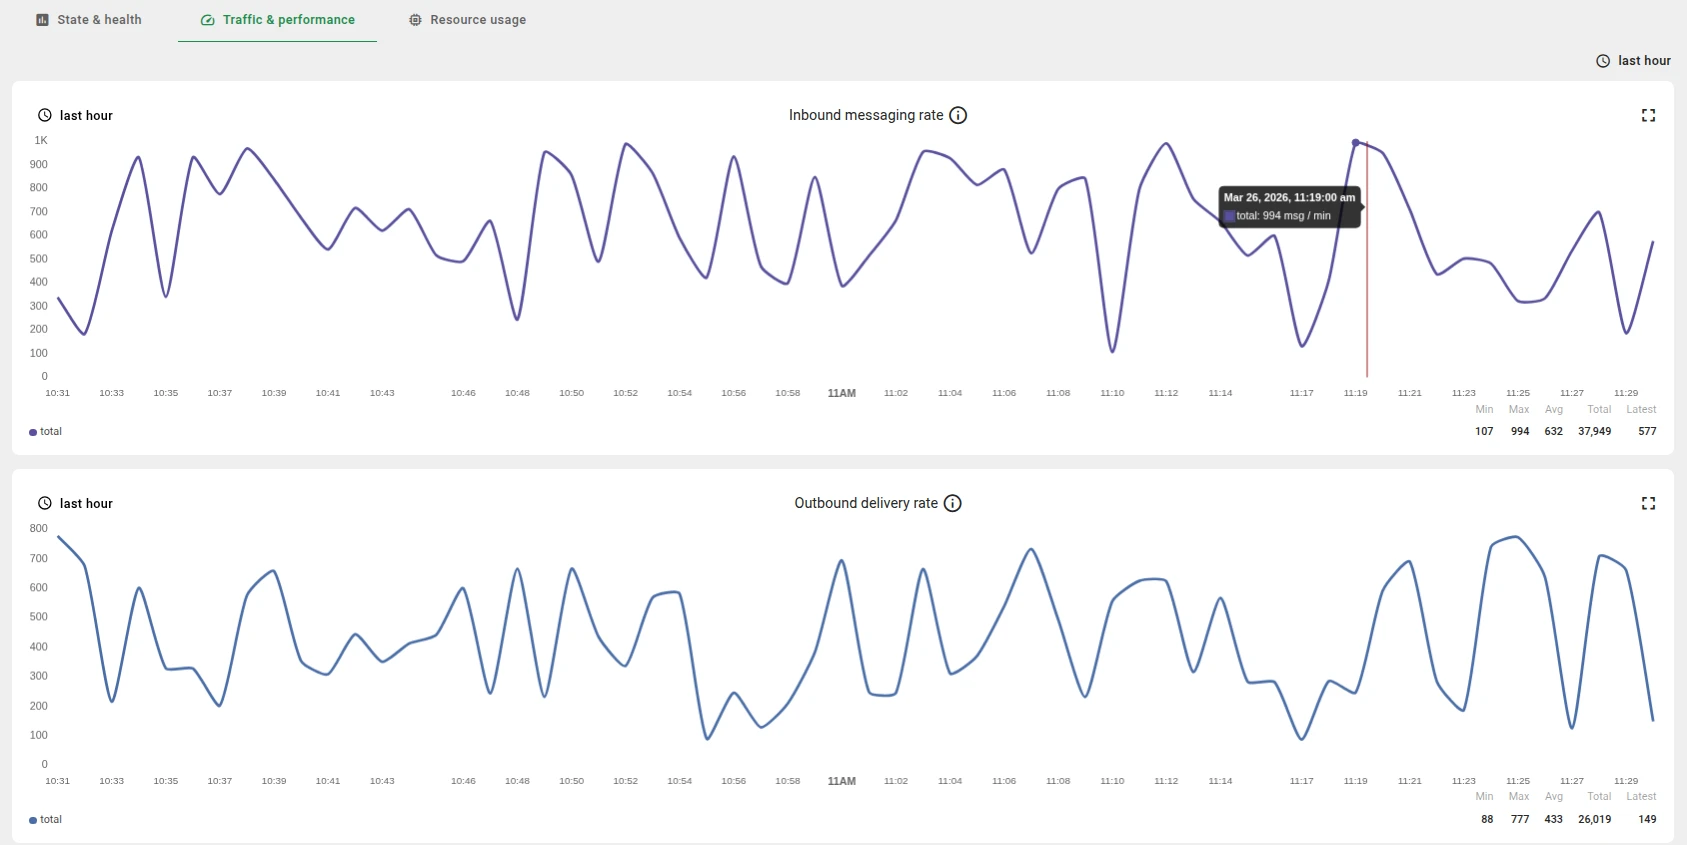
Section titled “Traffic & performance”The Monitoring > Traffic & performance page contains four charts focused on message throughput:
- Inbound messaging rate — measures the rate of messages published to the broker by MQTT clients.
- Outbound delivery rate — measures the rate of messages delivered from the broker to subscribers.
- Inbound payload traffic — measures the total byte size of the message content received by the broker from publishers. This metric excludes all MQTT protocol overhead (headers, acknowledgments, control packets).
- Outbound payload traffic — measures the total byte size of the message content delivered by the broker to subscribers. This metric excludes all MQTT protocol overhead (headers, acknowledgments, control packets).
How chart data is collected
Section titled “How chart data is collected”Each broker node counts messages locally and, at the end of every collection interval, writes its own counters to the time series database and publishes them to the tbmq.sys.historical.data Kafka topic, where they are summed into a cluster-wide total series. Sessions, Subscriptions and Retained message count are cluster-wide values only: they are read from the shared caches and stored as total, with no per-node breakdown.
- Collection is enabled by default and controlled by
HISTORICAL_DATA_REPORT_ENABLED. Set it tofalseand the charts stay empty — nothing else in the broker is affected. - The collection interval is set by
HISTORICAL_DATA_REPORT_INTERVAL, in minutes, default1. Only values from1to60are accepted; the broker refuses to start otherwise. The same value is shown as Statistics collection interval on the Broker settings card. - Chart values are counts per collection interval, not per second. The legend and tooltip units spell this out:
msg / minat the default interval,msg / 5 minif you raise the interval to five. - Real-time charts refresh once a minute, independently of the collection interval.
- When the cluster has more than one broker node, each chart gets an additional series per node, labelled with the node’s service ID. Only
totalis drawn initially; click a node in the legend to load and display its series. - History is kept for seven days by default: time series records expire after
SQL_TTL_TS_KEY_VALUE_TTLseconds (604800), removed by a cleanup task that runs once a day. Selecting a longer range returns no data beyond that point. Set the value to0to keep records indefinitely, orSQL_TTL_TS_ENABLEDtofalseto disable the cleanup task. - A single chart request returns at most 50,000 data points. When a chart hits that limit, the UI shows a warning asking you to narrow down the time range selection.
Sessions and credentials
Section titled “Sessions and credentials”The Sessions card shows three counts — Connected, Disconnected and Total. Clicking a count opens the Sessions page filtered by that connection state.
The Credentials card displays the number of Client Credentials as Devices, Applications and Total. Clicking a count opens the client credentials page filtered by that client type. See Client types for the distinction.

Broker settings
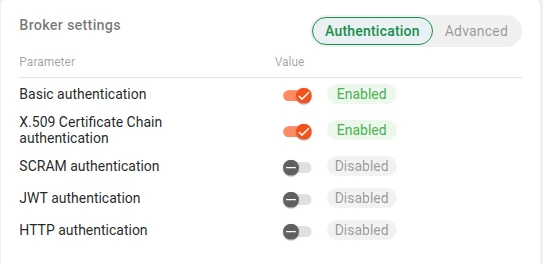
Section titled “Broker settings”The Broker settings card has two tabs: Authentication and Advanced.
The Authentication tab shows each authentication provider as Enabled or Disabled, and lets you switch it by clicking the toggle in its row:
- Basic authentication
- X.509 Certificate Chain authentication
- SCRAM authentication
- JWT authentication
- HTTP authentication
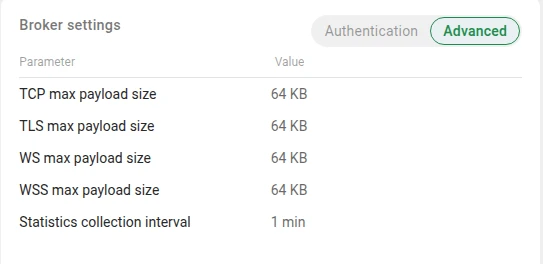
The Advanced tab shows broker-level parameters. They are read-only here — change them through the corresponding environment variables and restart the broker:
- TCP max payload size — maximum payload size for the TCP listener (
TCP_NETTY_MAX_PAYLOAD_SIZE, 64 KB by default). - TLS max payload size — maximum payload size for the TLS listener (
SSL_NETTY_MAX_PAYLOAD_SIZE, 64 KB by default). - WS max payload size — maximum payload size for the WS listener (
WS_NETTY_MAX_PAYLOAD_SIZE, 64 KB by default). - WSS max payload size — maximum payload size for the WSS listener (
WSS_NETTY_MAX_PAYLOAD_SIZE, 64 KB by default). - Statistics collection interval — how often broker statistics are collected (
HISTORICAL_DATA_REPORT_INTERVAL,1 minby default).
Network settings
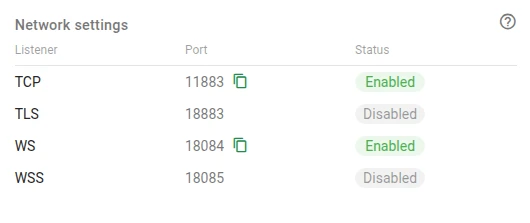
Section titled “Network settings”The Network settings card displays each listener’s port and status:
- TCP — plain MQTT listener, enabled by default on port
1883. - TLS — MQTT over TLS listener, disabled by default (
LISTENER_SSL_ENABLED), port8883. - WS — MQTT over WebSocket listener, enabled by default on port
8084. - WSS — MQTT over secure WebSocket listener, disabled by default (
LISTENER_WSS_ENABLED), port8085.
The status is Enabled or Disabled, and the port of an enabled listener has a copy button next to it. The port shown is the one configured in the Connectivity settings when an override is enabled for that protocol, and the listener’s own bind port otherwise — so it may differ from the port the broker actually binds.
Resource usage statistics
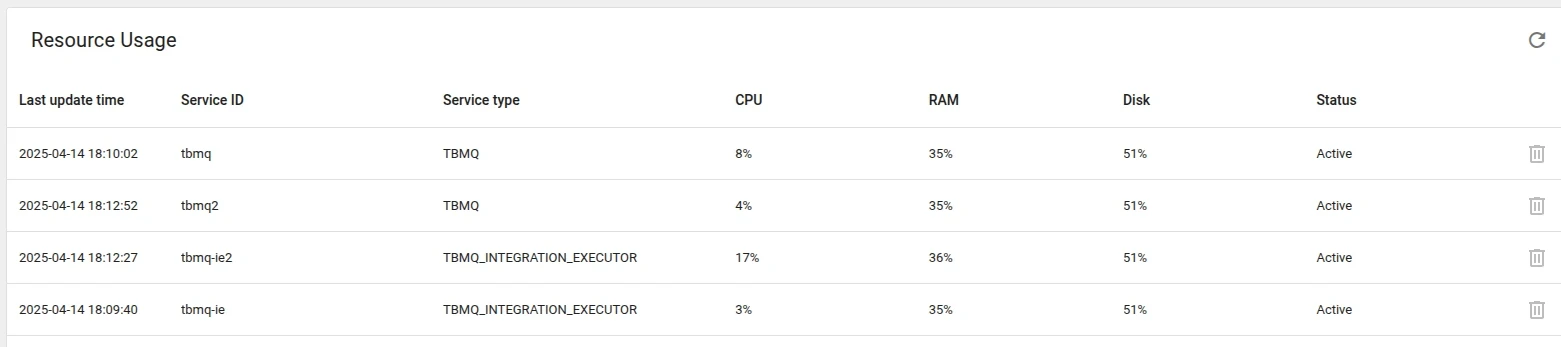
Section titled “Resource usage statistics”The Monitoring > Resource usage page provides runtime resource usage statistics for each service instance — both TBMQ broker nodes and TBMQ Integration Executor instances — helping monitor system behavior and support debugging or optimization.
CPU and memory statistics are collected using the OSHI Java library, which retrieves hardware and OS statistics directly from the host environment. Disk usage and capacity are read from the root filesystem (/) of the service’s container or host, so in a container they reflect that container’s filesystem, not the whole node. Metrics are updated every 60 seconds by default, controlled by:
# Persist frequency of system info (CPU, memory usage, etc.) in secondspersist-frequency: "${STATS_SYSTEM_INFO_PERSIST_FREQUENCY_SEC:60}"The Resource Usage table includes:
- Last update time — timestamp of the most recent metrics update.
- Service ID — identifier of the service instance.
- Service type —
TBMQorTBMQ Integration Executor. - CPU — CPU load percentage (hover to see available CPU cores).
- RAM — physical memory usage percentage (hover to see total memory in GB).
- Disk — disk space usage percentage (hover to see total disk capacity in GB).
- Status:
Active— reported less than 1 hour ago.Inactive— reported between 1 hour and 1 week ago.Outdated— reported more than 1 week ago.
A CPU, RAM or Disk value above 75% is marked with a warning icon, and above 85% the hover text escalates to a critical warning. In both cases the hover text replaces the usual total-capacity hint.
TBMQ tracks all registered services in Redis under the key tbmq:service:registry. A service registers itself as soon as it starts, but its first metrics arrive only one persist period later (60 seconds by default) — until then the row shows empty values and the Outdated status.
Services are not removed automatically. To delete one, use the Delete outdated service action in its row, or call DELETE /api/app/service/info?serviceId={serviceId}. The row action is enabled only for services in the Outdated status, so a node that stopped reporting cannot be removed from the table through the UI until a week has passed; the REST endpoint has no such restriction.
Was this helpful?